|
Test of assumption
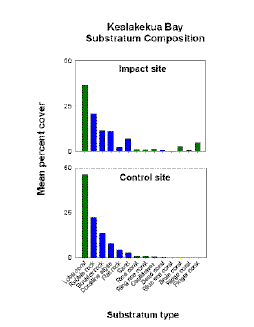
A comparison of overall substratum composition between the
two sites can be used to test the assumption that control and impact sites
are similar. In figure 5 the percent composition of both living coral
(green) and non-living bottom types (blue) are shown for comparison at
both sites. Both areas were characterized by a predominance of lobe coral
(Porites lobata), and a mixture of coral rubble, coral boulders,
and patches of coralline algae. At the impact site finger coral (Porites
compressa), false brain coral (Pavona varians), and ridge coral
(Pavona duerdeni) was more common than at the control site.
Overall the percent similarity between sites is 89%,
indicating high similarity in the substratum composition at both sites.
These results verify that sites are very similar and thus the major
differences between them can likely be attributed to the human use
differences (more divers at the impact site). |

Figure 5. Comparison of substratum types
at control and impact sites. |
|
Changes in coral abundance
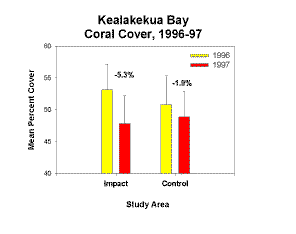
Both sites had similar mean percent live coral cover with
the impact site at 54% and the control at 52% (figure 6). Between the one
year survey period, the percent cover declined at both sites. Although the
decline was greater at the impact site (5.3%) relative to the
control site (1.9%), neither of these declines were statistical significant
(P< 0.05).
|

Figure 6. Change in live coral cover after a one
year interval at control and impact sites. |
|
Bleached coral
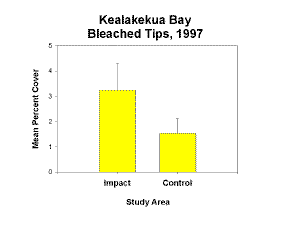
The percent cover of bleached
coral tips at sites in 1997 was higher at the impact (3.1%) site relative
to the control (1.8%). However, these differences were not statistically
significant (two-sample t-test, P< 0.05).
|

Figure 7. Percent bleached coral tips at control
and impact sites in 1997. |
|
Broken coral
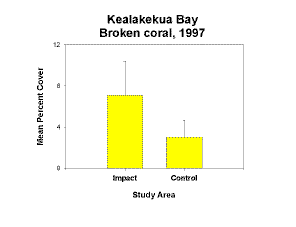
The percent cover of freshly
broken coral at sites in 1997 was higher at the impact (7%) site relative
to the control (3%). However, these differences were not statistically
significant (two-sample t-test, P< 0.05).
|

Figure 8. Percent broken coral at control
and impact sites in 1997. |
